Spacetime Dialogue: Integrating Astronomical Data and Khoomei in Spatial Installation
"Northness": Poetic Visualization of Data Infrastructure Inequality
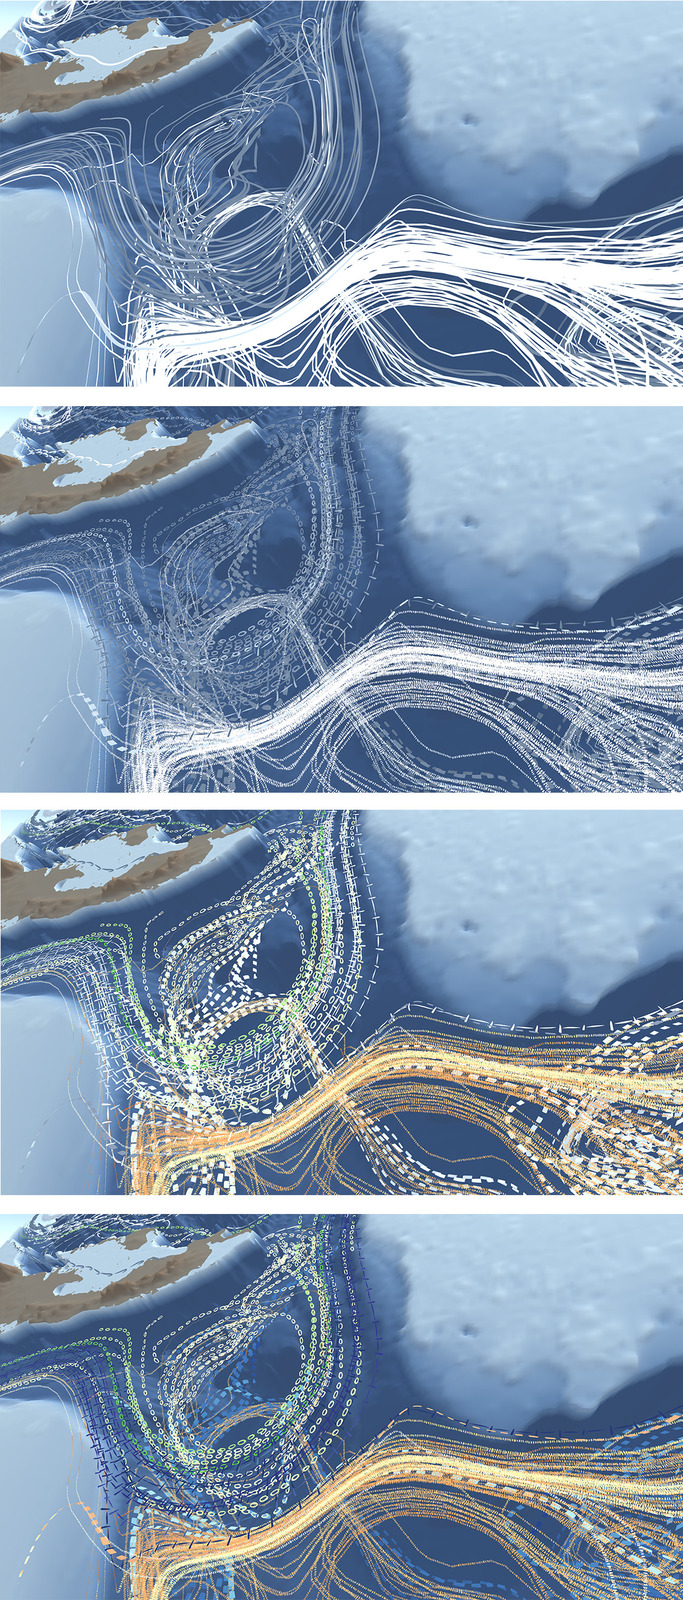
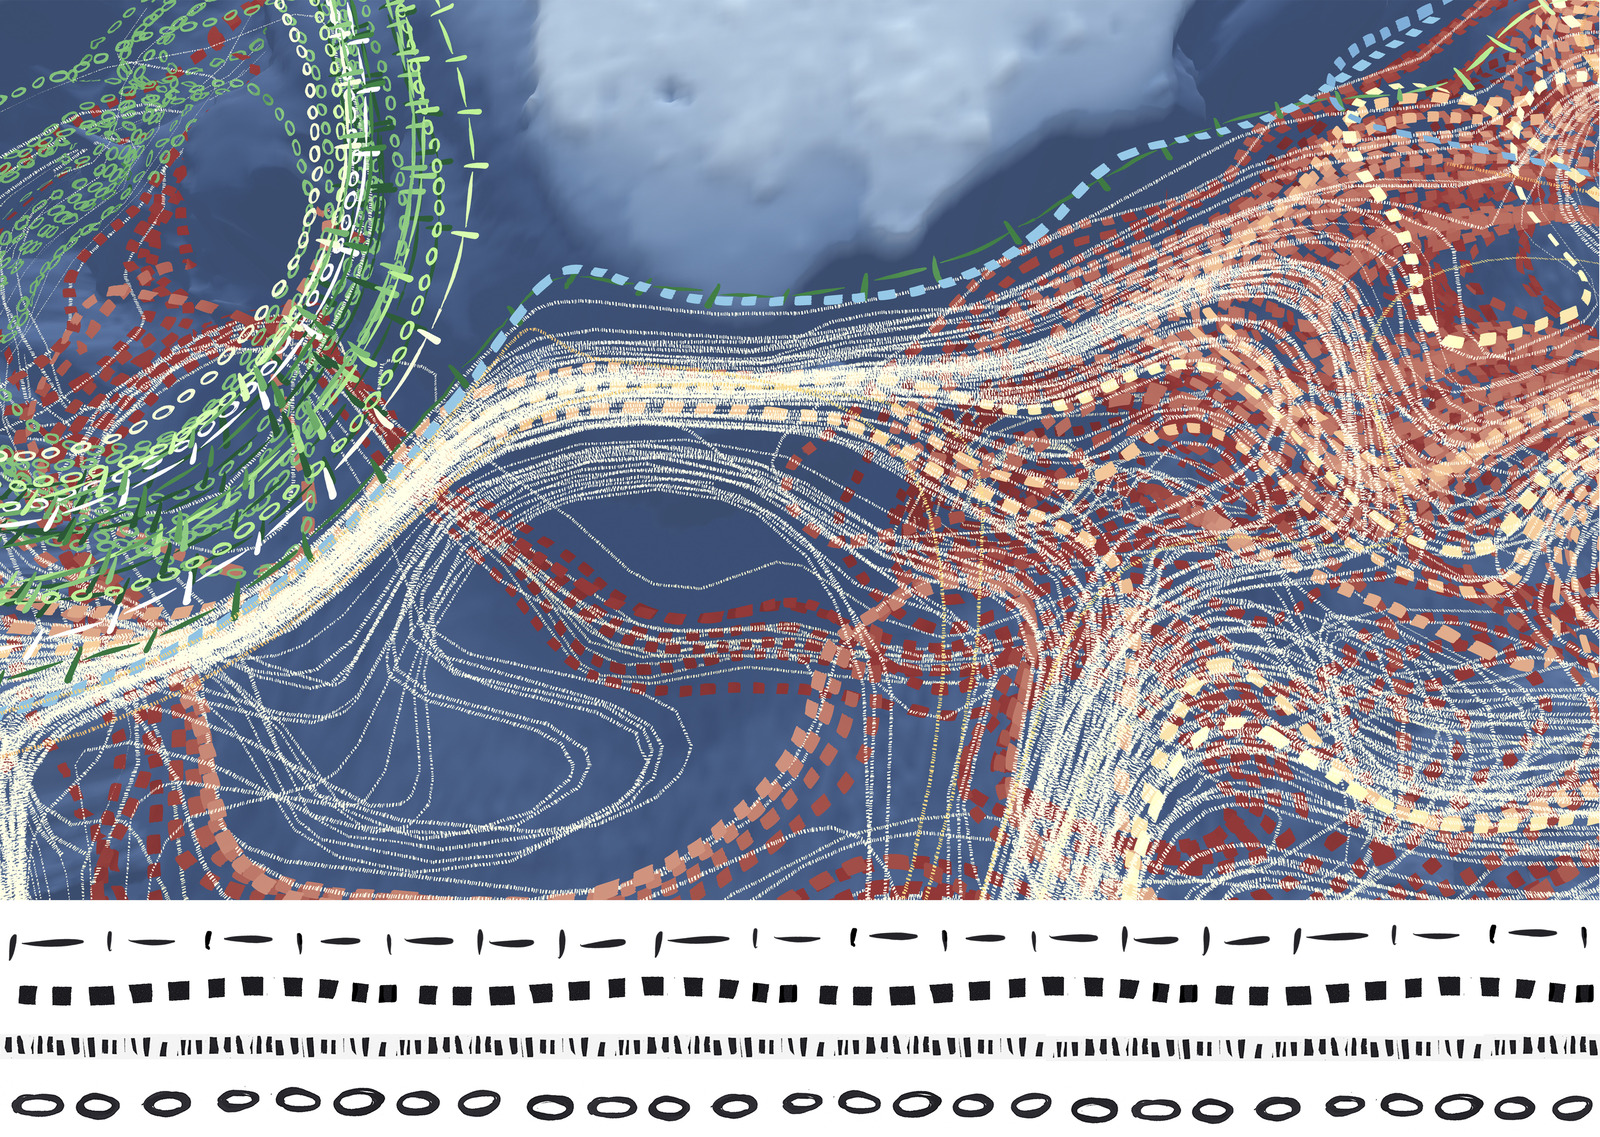
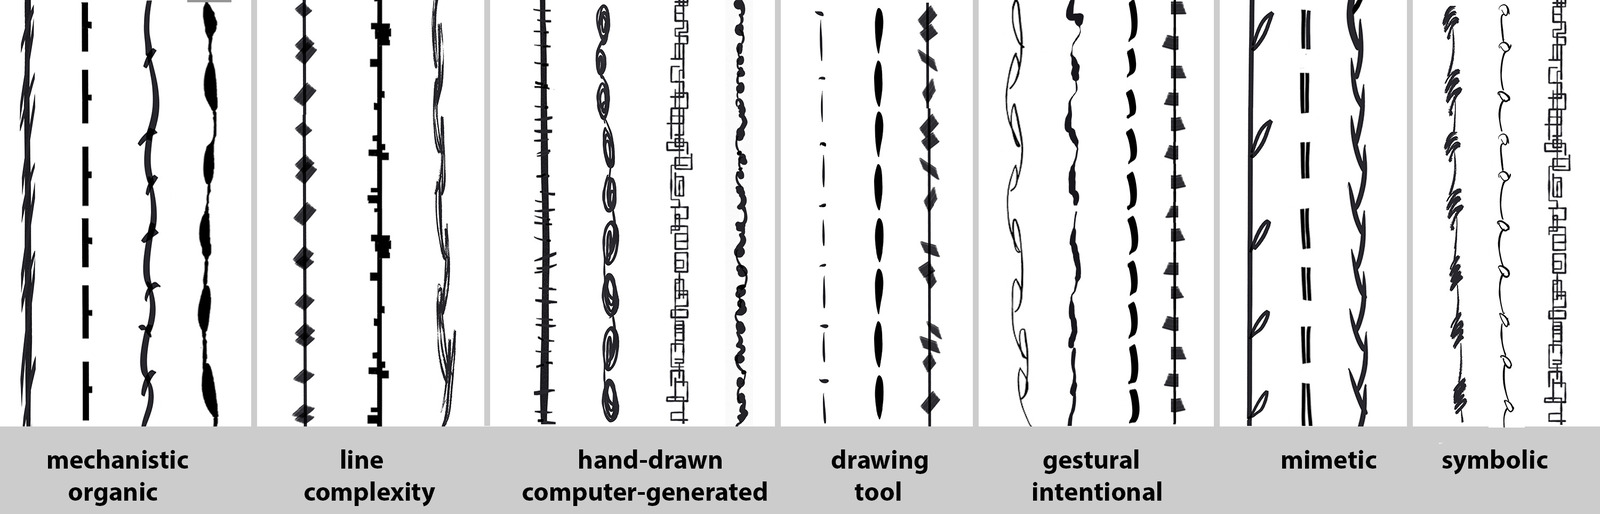
Data is moving beyond the scientific community, flooding communication channels and addressing issues of importance to all aspects of daily life. This highlights the need for rich and expressive data representations to communicate the science on which society rests and on which society must act. However, current visualization techniques often lack the broad visual vocabulary needed to accommodate the explosion in data scale, diversity and audience perspectives. While previous work has mined artistic and design knowledge for colour maps and shape affordances (glyphs) in visualization, line encoding has received little attention. In this paper we report on an exploration of visual properties that extend the vocabulary of the line, particularly for categorical encoding. We describe the creation of a corpus of lines motivated by artistic practice, gestalt theory and design principles and present initial results from a study of how different visual properties influence how people associate these into sets of similar lines. While very preliminary, the findings suggest a rich set of line visual features to support both association and categorical hierarchies, and provoke further inquiry into how and why line encoding can be more expressive encoding multivariate, multidimensional data.
Contributors

|
Francesca Samsel Focusing on multidisciplinary collaboration, Francesca Samsel, a research scientist who trained as an artist, collaborates with environmental scientists, scientific visualization research teams, applying her artistic voice to the science that underpins the climate challenges of this generation. |

|
Dr. Lyn Bartram |
|
|
Dr. Greg Abram |
|
|
Anne Bowen |